In the context of the rapid development of 3D technology, point cloud data has emerged as an indispensable pillar, providing a detailed and objective view of the real world. Understanding point cloud data, its formats, and its role across various fields is the key to unlocking its vast potential.
Table of Contents
Overview of Point Cloud and the role of data in 3D technology, as-built surveys, and BIM construction.
In the era of digitalization and booming 3D technology, point cloud data has established itself as one of the most important data types, delivering a realistic and comprehensive representation of the physical world around us. A point cloud, essentially a “cloud of points,” is a massive collection of points in 3D space, with each point representing a specific location on the surface of an object or environment that has been scanned. These points are not just coordinates (X, Y, Z), but can also contain additional information such as color (RGB), laser reflection intensity, time-of-flight, or object classification — turning them into a vivid, detailed, and extremely useful digital representation.
The importance of understanding point cloud data formats for proper selection and processing cannot be overstated. Each format has its own characteristics in terms of structure, information storage capability, compression level, and compatibility with different software. Choosing the right format affects not only storage efficiency and processing speed but also the integration of point cloud data into the overall workflow, especially in specialized fields such as surveying, BIM (Building Information Modeling), or even AR/VR development. A wrong choice can lead to data loss, reduced quality, or significant obstacles in collaboration. Mastering these aspects enables professionals to optimize workflows, enhance project quality, and fully leverage the value of point cloud data.
The nature and importance of Point Cloud in the digital era
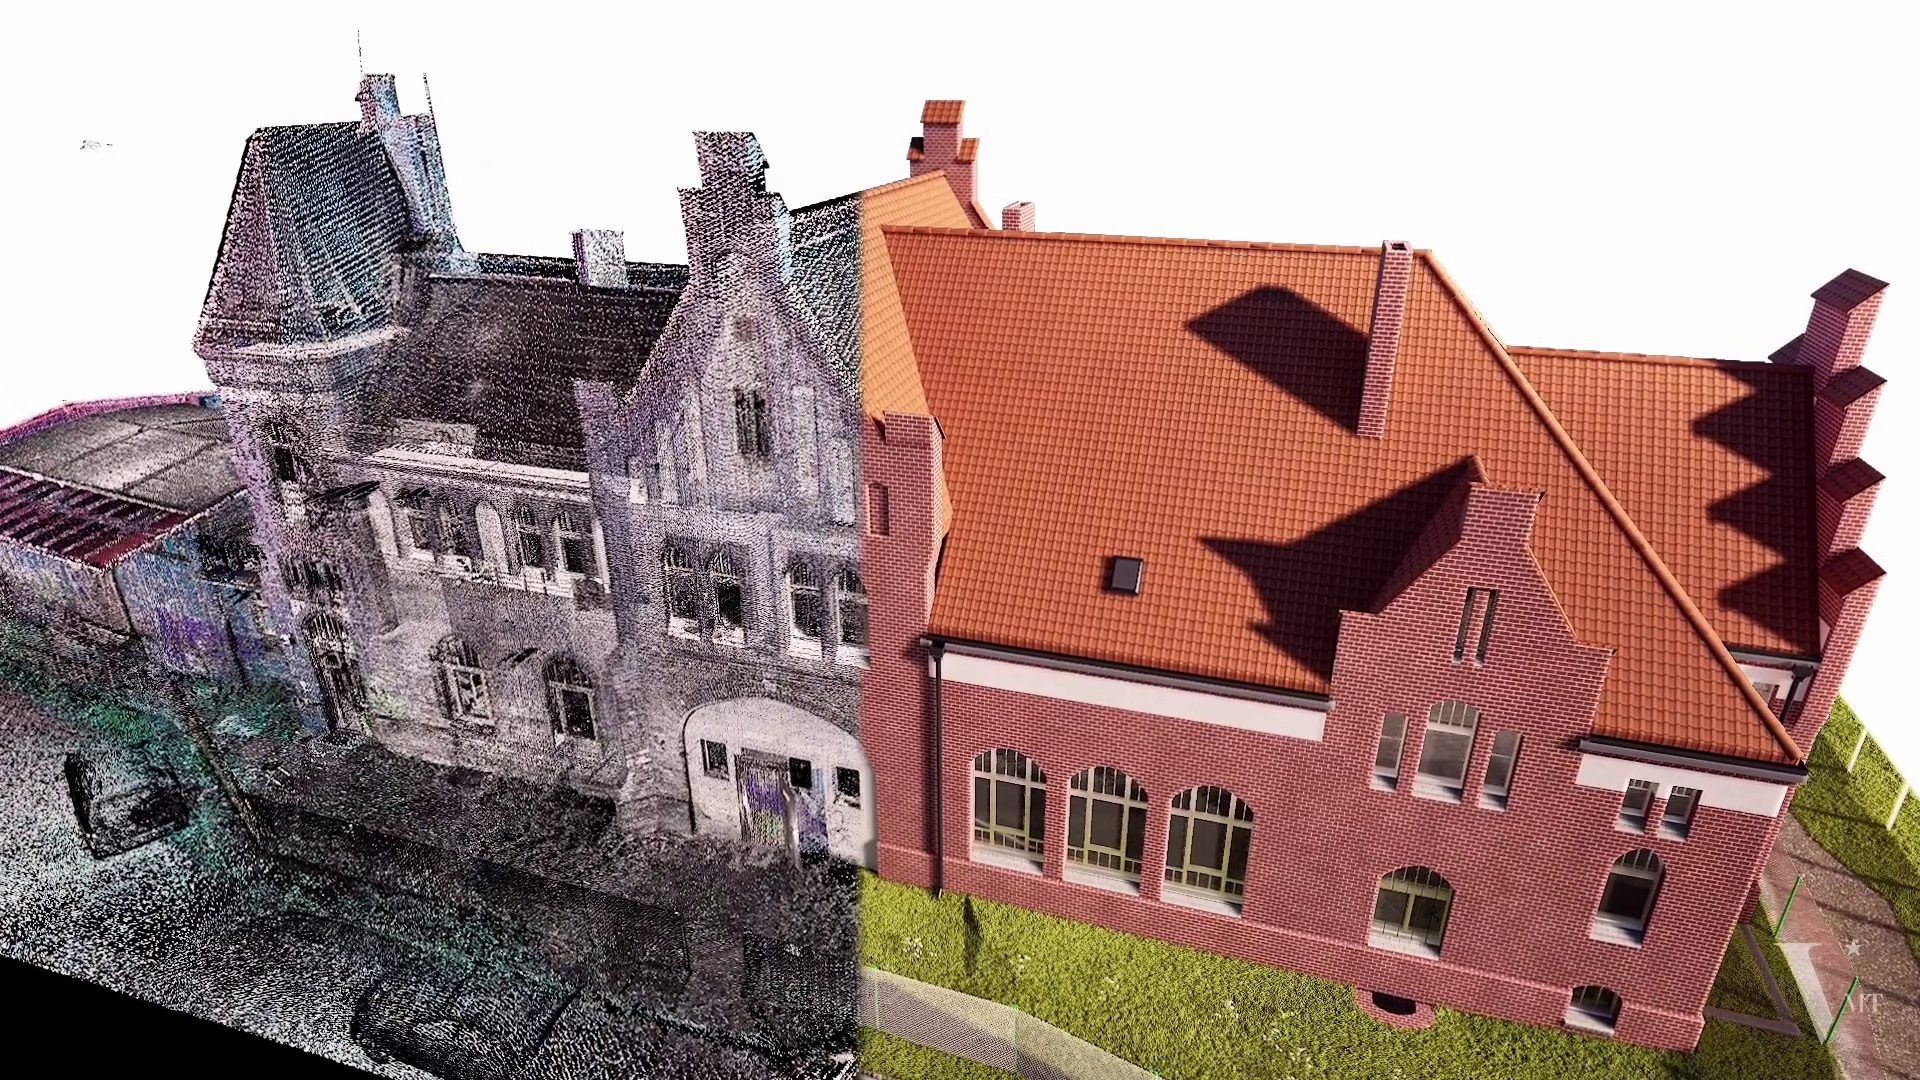
Point clouds represent a powerful method of capturing three-dimensional spatial data, allowing us to “digitize” the physical world with unprecedented accuracy and detail. From complex architectural structures and vast terrains to the smallest mechanical details, point clouds can faithfully capture every surface, shape, and structure. The boom of 3D scanning technologies such as terrestrial laser scanners (TLS), UAVs equipped with LiDAR, and photogrammetry cameras has made collecting point cloud data easier and more widespread than ever, making it an indispensable tool across industries.
The importance of point clouds lies not only in replicating reality but also in their potential to analyze and extract information from point cloud data. They provide an objective data source, free from the subjective interpretation of traditional 2D drawings. This empowers engineers, architects, and urban planners to make evidence-based decisions, optimize designs, verify construction accuracy, and plan maintenance. In today’s digital age, where precision and efficiency are paramount, point clouds are truly a fundamental data foundation for smart applications and automation.
The role of Point Cloud in as-built surveys and urban planning
In the field of topographic and as-built surveys, point cloud data has revolutionized the way these tasks are performed. Instead of time-consuming traditional methods like manual measurement or using total stations with limited points, point cloud scanning technology allows for the collection of millions of data points in a short time, generating a dense and accurate 3D model of the existing environment. This not only accelerates workflows but also minimizes human errors, providing a more comprehensive and objective view of the current state.

Point cloud data is particularly useful for surveying hard-to-reach areas, historic buildings that require preservation, or complex infrastructure projects. It serves as the foundation for automatically generating floor plans, sections, and elevations, or for monitoring structural deformations over time. In urban planning, point clouds provide detailed insights into urban spaces, building density, vegetation, and infrastructure — enabling planners to make more informed decisions regarding development, public space management, and quality-of-life improvements. The ability to access and analyze comprehensive 3D data from point clouds marks a significant leap forward in visualizing and managing our urban environments.
The Application Value of Point Cloud in Building Information Modeling (BIM)
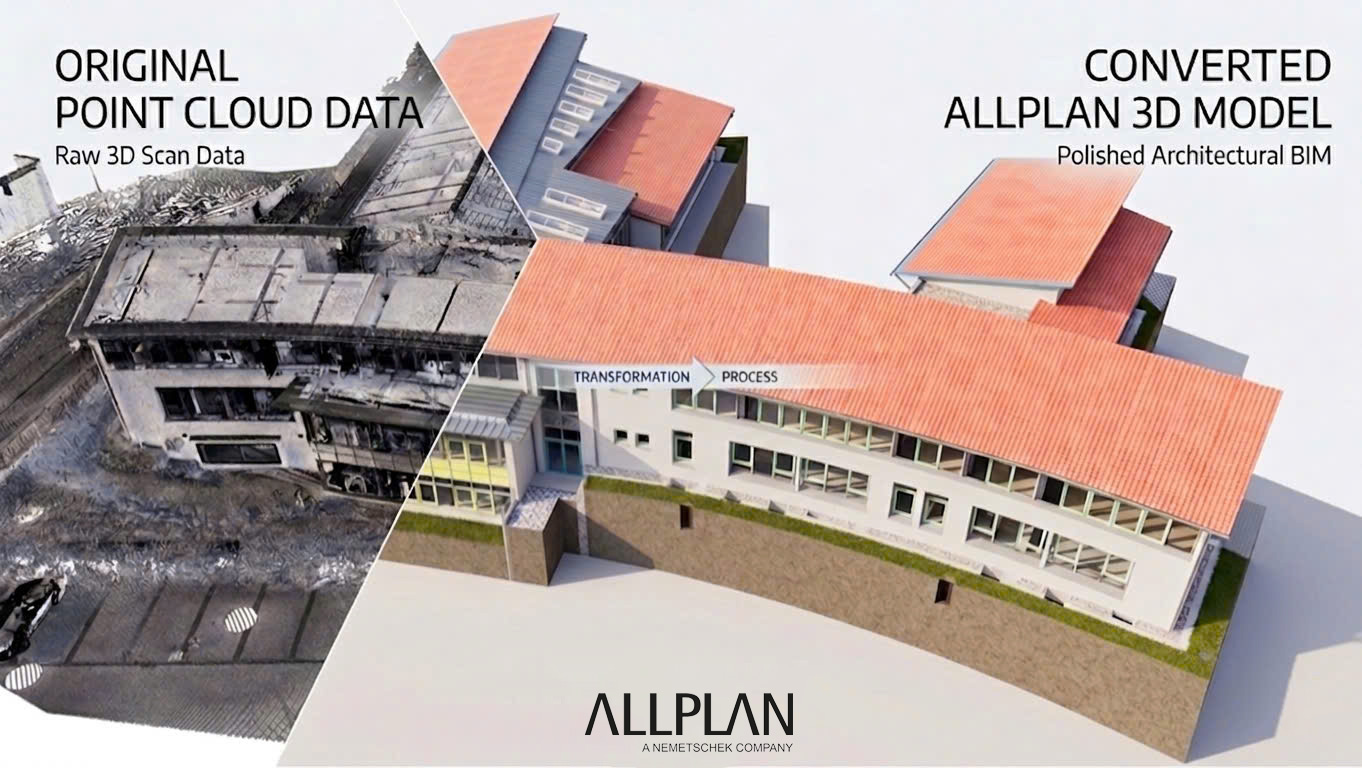
In the construction industry, BIM has become a standard for designing, building, and managing projects. And point cloud data is the crucial bridge between the physical world and the digital BIM model. When combining Point Cloud with BIM, our ability to manage the project lifecycle reaches a new level. Point cloud data is used to create “As-built BIM” by scanning existing structures and converting them into detailed BIM models. This is particularly valuable in renovation, expansion, or maintenance projects, where original drawings may no longer be accurate or complete.
Thanks to point cloud data, designers and engineers can efficiently detect clashes between new systems and existing structures, ensuring that every change aligns with reality. It also helps track construction progress by comparing point cloud data of the ongoing project with the BIM design model, quickly identifying any discrepancies. Furthermore, Point Cloud provides a reliable foundation for construction planning, asset management after completion, and even integration with Facility Management (FM) systems. Using point cloud data in BIM is not just a tool but a new mindset that reduces costs, increases efficiency, and improves overall project quality.
The Importance of Understanding Data Formats to Optimize Point Cloud
Collecting point cloud data is only the beginning; the real value lies in processing, managing, and using it effectively. To achieve this, understanding the formats of point cloud data is essential. Each format is not just a storage method but comes with its own characteristics in terms of structure, compression, the amount of information it can hold, and most importantly, compatibility with various specialized software. One format may be optimal for initial collection and storage (e.g., scanner manufacturer formats), while another may excel in compression, data exchange over networks, or integration into 3D design software.
Without a deep understanding of these formats, professionals may face significant challenges. For example, choosing an unsuitable format can result in huge file sizes, slowing down processing and data transfer. Worse, it may cause the loss of critical information such as color, reflection intensity, or classification attributes, reducing the value of point cloud data. On the other hand, choosing the optimal format simplifies workflows, maximizes software performance, and ensures data integrity throughout the project lifecycle. This is particularly important in collaborative environments where data exchange between parties, each using different tools and processes, is key to success. Therefore, investing time in studying and mastering point cloud data formats is not just a necessary skill but also a significant competitive advantage in the 3D technology industry.
Definition of Point Cloud and Point Cloud Data
Point Cloud, also known as a “cloud of points,” is a central concept in the world of 3D technology and digital space. Simply put, it is a collection of discrete points in three-dimensional space, where each point represents a specific location on the surface of an object or environment. Imagine using a brush to paint an object, but instead of continuous strokes, you place countless tiny dots, dense enough that from a distance, these dots form the recognizable shape of the object. That is the basic idea behind the definition of Point Cloud.
However, point cloud data is not just a series of coordinates (X, Y, Z). To be truly valuable, each point in the cloud often comes with additional information, enriching this digital “picture.” This includes color, light reflection intensity (intensity), timestamp, or even classification attributes indicating whether the point belongs to the ground, vegetation, a building, or a vehicle. These diverse attributes transform the Point Cloud from a mere collection of points into a vivid, detailed 3D model that can be deeply analyzed, unlocking countless practical applications in industries ranging from construction and manufacturing to scientific research.
The Basic Concept of Point Cloud – “Cloud of Points”
At its core, a Point Cloud is a digital representation of physical reality created by collecting millions, sometimes billions, of individual data points in 3D space. Each point has a unique position defined by three coordinates: X, Y, and Z. For example, in a Point Cloud model of a building, each point may represent a small part of a wall, floor, or window. Importantly, these points are not connected to each other, but form a dense “cloud” that, when viewed with the naked eye or specialized software, creates a recognizable image of the original object.
The creation of a Point Cloud usually involves 3D scanning technologies such as laser scanning (LiDAR), photogrammetry (image capture combined with software to generate 3D models), or even depth sensors like Kinect. Each technology has different operating principles but shares the same goal: collecting large amounts of data points with precise coordinates. The accuracy and density of the points in a Point Cloud are crucial factors determining the quality and detail of the resulting 3D model. A denser point cloud provides more information and allows a more faithful reconstruction of the object but also requires larger storage capacity and more powerful processing.
The Components of a Complete Point Cloud Dataset
A point cloud dataset goes beyond simple coordinates (X, Y, Z). To be truly useful and provide a comprehensive understanding of the scanned environment, each point in the cloud typically includes a set of additional attributes that significantly increase its value. The most common attributes are color and reflection intensity.
Color (RGB – Red, Green, Blue) is assigned to each point, allowing the Point Cloud model to display in realistic colors, providing a more intuitive experience and helping to distinguish surfaces and materials. Color information is often captured simultaneously by a scanner’s integrated camera or through image mapping. Reflection intensity is a numerical value representing the strength of the laser signal reflected back to the sensor. This depends on the material, color, and angle of the surface, offering valuable insights into the physical properties of the object, even without color information. For example, metals typically have higher reflectivity than wood. In addition, point cloud data may include information about return numbers (multiple laser reflections from different surfaces, such as foliage) or classification attributes (ground, vegetation, buildings, roads), which makes it easier to filter and analyze data for specific purposes. This richness of attributes turns point cloud data into a powerful “bank” of 3D spatial information capable of supporting many types of complex analyses and designs.
From Data Collection to Point Cloud Formation
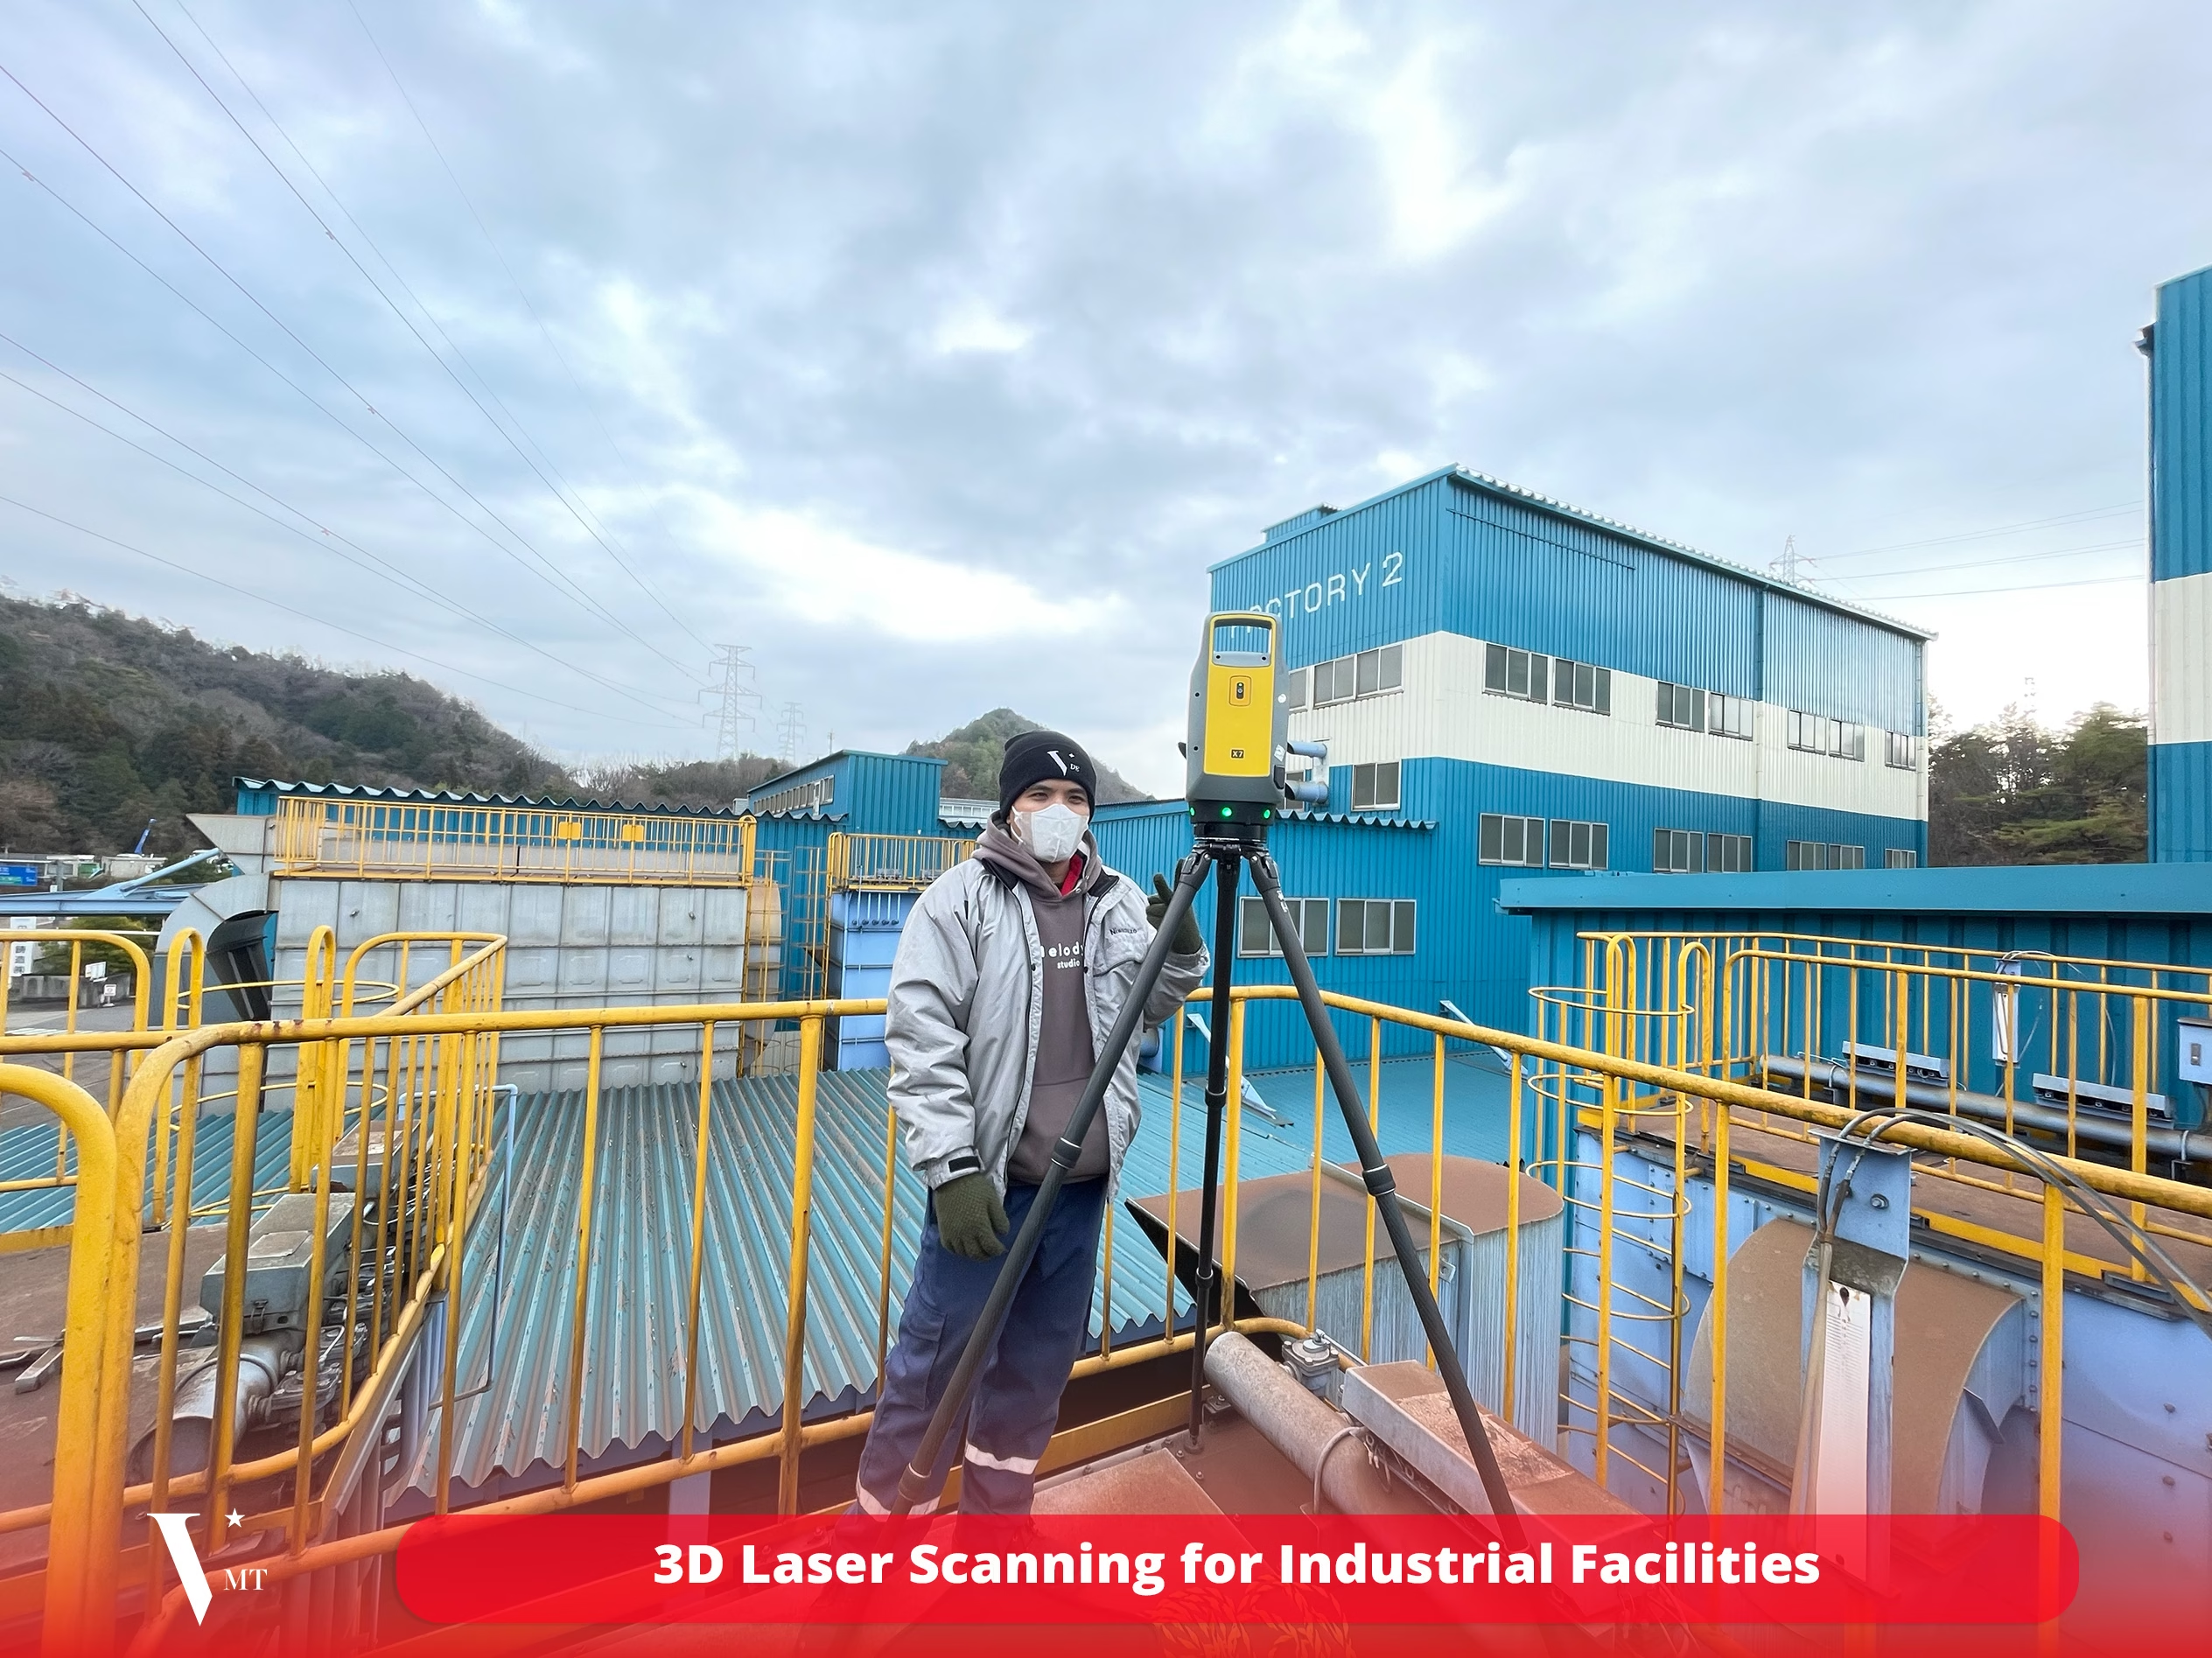
The creation of a complete point cloud dataset is a sequence of high-tech steps, starting with raw data collection and ending with a usable 3D model. The first and most crucial step is data acquisition, typically performed by specialized equipment such as 3D laser scanners (TLS, HLS – Handheld Laser Scanner, MLS – Mobile Laser Scanner, UAS/UAV LiDAR), or by photogrammetry using high-quality cameras and image processing software. Each method has its advantages and limitations in terms of speed, accuracy, coverage, and cost. For example, laser scanners deliver high accuracy even in low-light conditions, while photogrammetry excels in capturing vivid colors and has lower initial equipment costs.
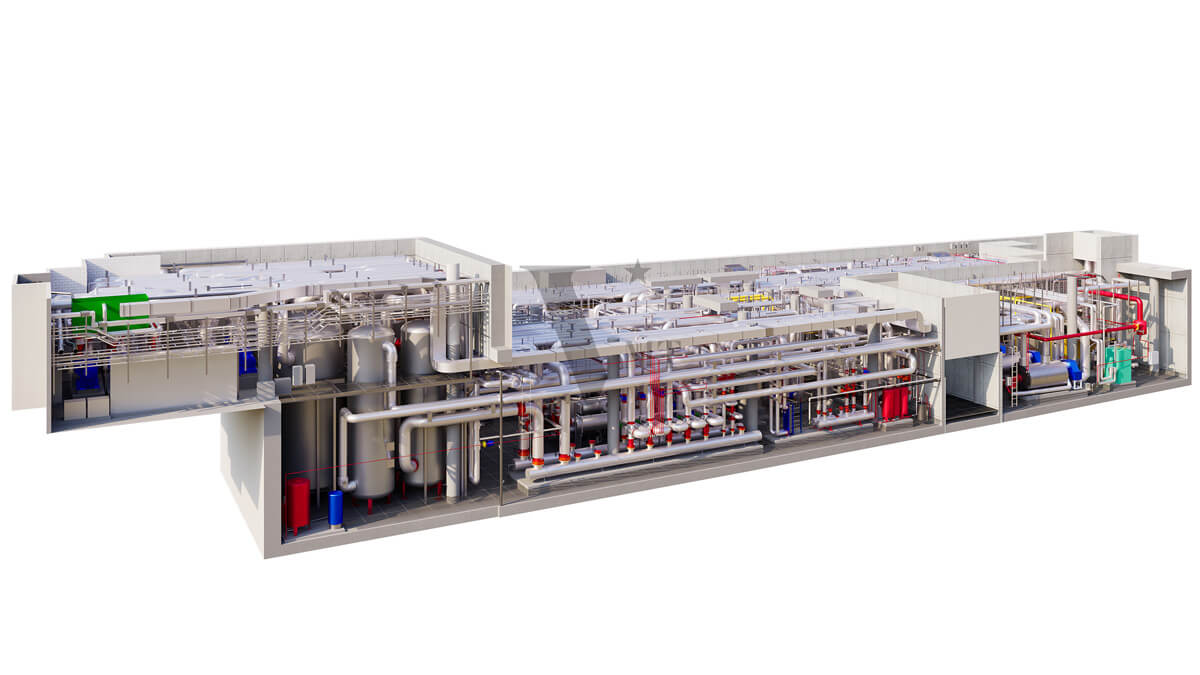
After raw data is collected (often in large manufacturer-specific files or image sets), the next step is preprocessing. This includes registration — aligning and merging individual scans or image sets into a common coordinate system to create a unified, non-overlapping, and accurate point cloud. The following steps are noise reduction, removing unwanted points, and data normalization. Depending on the project’s purpose, point cloud data can then be cleaned, compressed, and either used directly or converted into mesh models, surfaces, or 3D objects (e.g., walls, columns, pipes) for integration into design and modeling software (CAD/BIM). This process requires deep data knowledge and software skills, but the result is a digital twin of the real world, opening up countless applications.
Why Point Cloud Is More Than Just a Collection of Points
Although called a “cloud of points” and technically consisting of discrete X, Y, Z points, point cloud data goes far beyond this definition, becoming an immensely rich and multidimensional source of 3D spatial information. What makes Point Cloud powerful is not just the presence of coordinates but also the integration of non-geometric attributes and the ability to perform deep analysis from this data. Each point often carries values such as color (RGB), laser reflection intensity, classification information, and sometimes timestamps. These attributes allow us not only to see the shape of an object but also to understand surface characteristics, materials, and the surrounding environment. For instance, reflection intensity can help distinguish materials with similar colors, while classification enables automatic separation of vegetation from buildings.
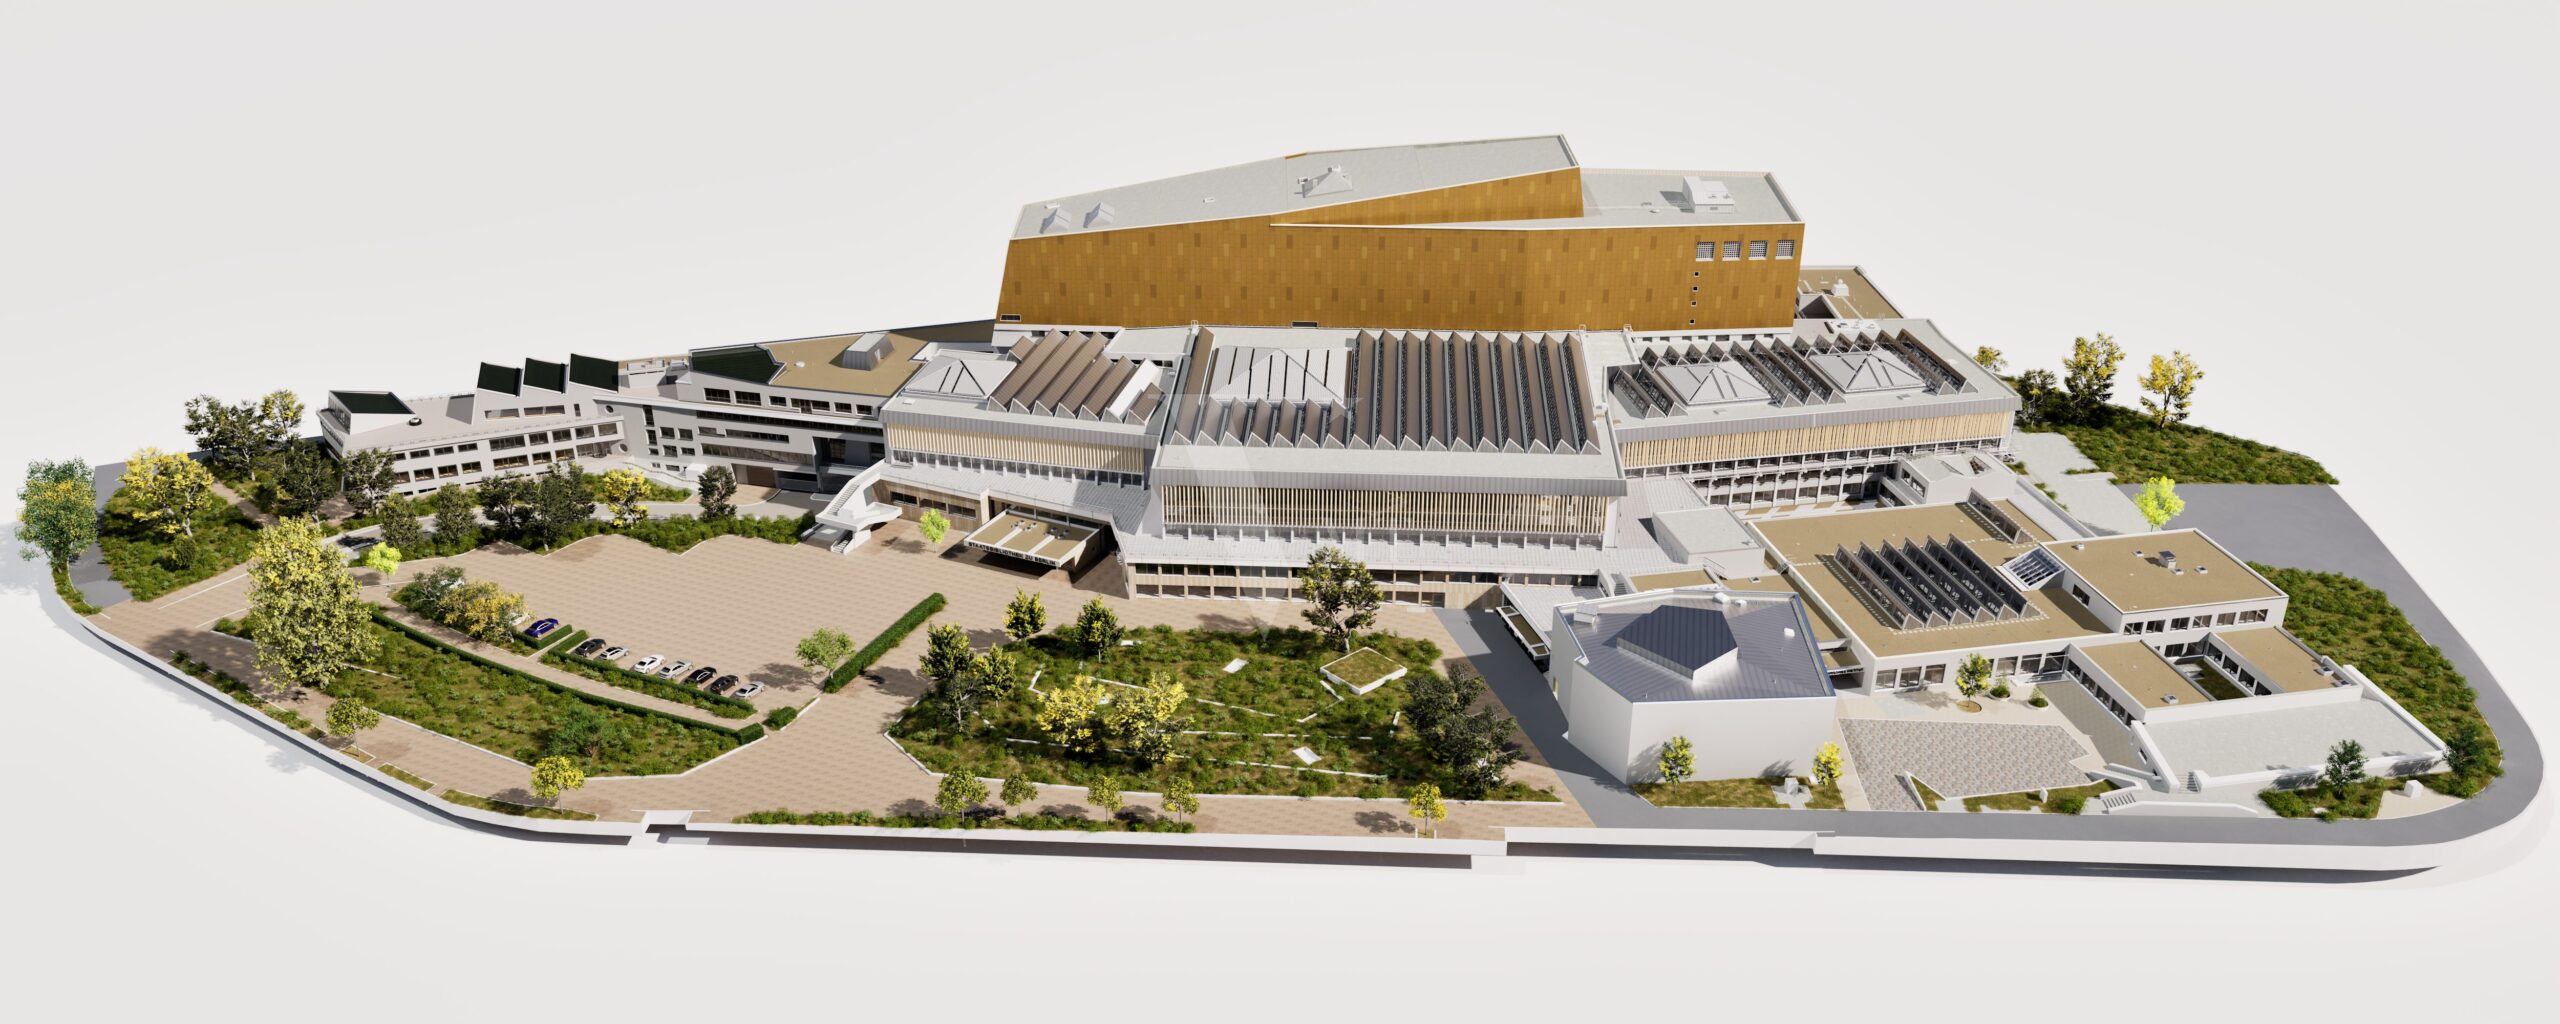
Moreover, the true potential of point cloud data lies in its ability to be transformed into meaningful and usable models within different workflows. From Point Cloud, we can generate accurate 2D drawings, 3D mesh models, or NURBS surface models for use in graphic design or manufacturing. More importantly, it forms the foundation for creating “As-built BIM” (Building Information Modeling), where each data point can be converted into intelligent objects with rich attribute information, serving the entire lifecycle of a construction project. Point Cloud is also a core element in virtual reality (VR) and augmented reality (AR) applications, where it provides a precise reference framework for overlaying digital information onto the physical environment. Therefore, point cloud data is not just a collection of points; it is a gateway to reproducing, analyzing, and interacting with the real world in digital space, making it an indispensable innovation tool across many modern industries.
Common Point Cloud Data Formats
The world of point cloud data is not limited to the concept of the “point cloud” itself but extends to a wide range of diverse file formats, each designed to serve different purposes, software, and workflows. Choosing the right format has a profound impact on the efficiency of the entire project, affecting file size, processing speed, the ability to preserve detailed information, and the level of compatibility with software tools. A good format can significantly save time and costs, while a wrong choice can lead to unwanted issues, from data loss to incompatibility between systems.
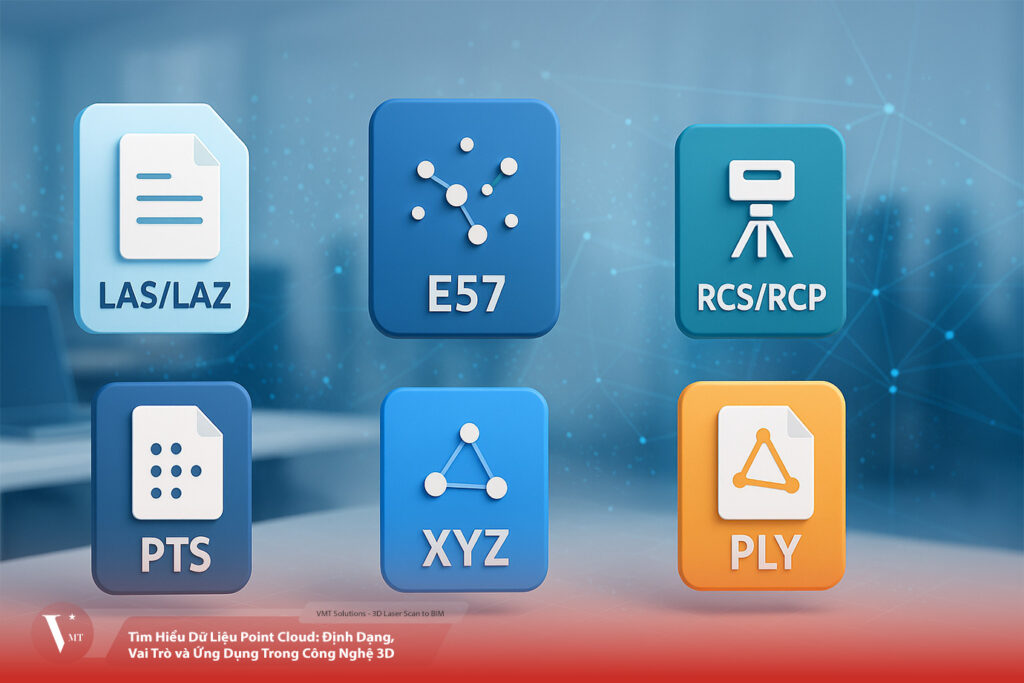
We will dive into exploring the most common point cloud data formats today, from proprietary formats developed by software vendors to open standards widely adopted by the community. Each format will be analyzed in terms of technical features, pros and cons, as well as their most common applications. Mastering this knowledge not only helps users make informed decisions when working with point cloud data but also allows them to optimize workflows, ensuring data quality and integrity throughout all stages of a project.
Below is an overview table of common point cloud data formats:
| Format | Key Features | Advantages | Disadvantages | Common Applications |
|---|---|---|---|---|
| LAS / LAZ | Industry-standard format, storing full attributes (coordinates, color, intensity, return time, classification). LAZ is the compressed version of LAS. | Open standard, widely supported by most CAD, GIS, and Point Cloud processing software. Preserves rich information. LAZ significantly reduces file size without data loss. | LAS files can be very large if not compressed. Sometimes converting proprietary formats to LAS/LAZ may result in loss of some specialized attributes. | Topographic surveys, airborne/UAV LiDAR, GIS, urban planning, forestry, asset management, construction quality control. |
| E57 | Open, neutral format developed by ASTM. Optimized for data exchange from multiple sources. | Cross-platform, independent of software/hardware vendors. Supports point data, panoramic images, and full metadata of each scan. Good for raw scan data storage and exchange. | Large file size due to storing full details, often not optimized for direct processing or visualization of large point sets in design software. | Point Cloud data exchange between different software/hardware, raw scan data storage, scanner testing and maintenance. |
| RCS / RCP | Proprietary format of Autodesk ReCap, designed to optimize performance in the Autodesk ecosystem. | Deep and efficient integration with Autodesk software (AutoCAD, Revit, Inventor, Navisworks). Fast processing and visualization of large point cloud data. | Works best only within Autodesk ecosystem. Sharing with users of other software requires format conversion. | BIM (Building Information Modeling), mechanical design, construction project management, inspection, plant design, workflows using Autodesk products. |
| PTS | Simple text format, each line is a point with coordinates and sometimes color/intensity. | Readable and editable with simple text tools. Highly flexible for customizing data columns. | Very large file size since it is uncompressed text. Slow loading and processing. Does not include metadata, coordinate systems, or complex layers. | Used in small projects with fewer points, or when editing/checking individual points. Basic data exchange between systems without special plugins. |
| XYZ | Basic text format containing only X, Y, Z coordinates. Sometimes includes 3 additional RGB columns. | Extremely simple, easily readable by any text-capable software. No complex format required. | Large file size, lacks important attributes (intensity, classification, metadata). No compression support. | Raw 3D data exchange when detailed attributes are not required, or when maximum cross-platform compatibility is needed. Mainly for simple outputs from algorithms or basic visualization. |
| PLY | Polygon File Format that can also store Point Clouds with color and attributes. | Flexible, can store Point Cloud, mesh, and custom attributes. Supports both ASCII and binary. Popular in 3D graphics and research communities. | Not specifically designed for large Point Clouds, so may not be as optimized as LAS/LAZ in terms of compression and lidar-specific attributes. | Academic research, computer graphics, 3D printing, object modeling, small object scanning, 3D image processing. |
LAS / LAZ Format – The Industry Standard in Land Surveying
The LAS (LASer) format and its compressed version LAZ are indispensable “workhorses” in the world of point cloud data, especially in land surveying, LiDAR, and GIS applications. Developed and maintained by the American Society for Photogrammetry and Remote Sensing (ASPRS), LAS quickly became a widely recognized and adopted open standard. The biggest strength of LAS lies not only in its popularity but also in its ability to store a large amount of rich information for each point. In addition to the basic X, Y, Z coordinates, LAS can also store important attributes such as laser return intensity, color information (RGB), return number, scan angle, and especially point classification. This classification system allows users to label each point — for example, ground, vegetation, building, power lines — making data filtering and analysis far more efficient.
The LAZ version is a compressed form of LAS, using a lossless compression algorithm, which means file sizes can be reduced significantly (up to 70–80%) without losing any original information. This is extremely important when handling massive point cloud data sets that can reach terabytes. LAZ compression saves storage space, speeds up data transmission over networks, and improves performance when working with Point Cloud processing software. Thanks to its openness, accuracy, and robust information storage, LAS/LAZ is supported by almost all professional software in the industry, such as ESRI ArcGIS, QGIS, Autodesk Civil 3D, TerraSolid, CloudCompare, etc. This makes LAS/LAZ the top choice for collecting, processing, and exchanging large-scale LiDAR point cloud data, from topographic mapping to environmental monitoring and infrastructure development. In my opinion, LAS/LAZ is not just a format but a universal language that fosters collaboration and seamless data exchange across platforms and industries.
E57 Format – Open Standard for Scan Data Exchange
The E57 format is an open, neutral standard developed under the auspices of ASTM International, with the primary goal of enabling reliable exchange of 3D point cloud data between different software and hardware from various manufacturers. This is crucial in today’s market, which is increasingly diverse in terms of hardware and software. E57 is designed to store not only point cloud data (coordinates, intensity, color) but also panoramic images captured by scanners, and most importantly, a large amount of detailed metadata for each individual scan. This metadata includes information about the scanning device, scan location, scan time, and even sensor calibration data, helping to maintain the provenance chain of the data.
The biggest advantage of E57 is its vendor independence. This eliminates compatibility barriers when project teams use scanners or software from different brands. For example, scan data from a Leica device can be easily opened and processed in Faro or Topcon software without complex conversions or risk of data loss. E57 becomes the “intermediate language” for storing the most complete raw scan data. However, because it stores such full and detailed information, E57 files are often very large — sometimes even larger than uncompressed LAS files. This makes E57 less ideal for directly processing or displaying massive point cloud data sets in design software. To overcome this, users often need to pre-process the data by reducing point density or applying compression before performing more complex tasks in software.
RCS / RCP Formats – Essential Partners in Autodesk Projects
RCS (ReCap Scan) and RCP (ReCap Project) are proprietary formats developed by Autodesk, designed for managing and processing point cloud data in Revit and other Autodesk design applications. RCS stores individual point cloud scans, while RCP acts as a container that references multiple RCS files and related information. This combination creates a convenient environment for integrating point cloud data into BIM (Building Information Modeling) workflows.
One of the key advantages of RCS/RCP is their high compatibility with other Autodesk products. Importing point cloud data into Revit or AutoCAD becomes seamless, enabling architects and engineers to leverage Autodesk’s powerful toolset for analysis and design. This not only saves time but also increases accuracy during the design process, as users can directly reference point cloud data within their 3D workspaces.
However, like E57, RCS/RCP can generate large files, making sharing and storage more difficult, especially in diverse work environments where not everyone uses Autodesk software. Therefore, while RCS/RCP is very powerful within the Autodesk ecosystem, conversion to open formats is sometimes necessary to ensure flexibility and interoperability across different platforms.
PTS Format – Readable Text Structure with Limitations
PTS (Point Cloud Text Stream) is a format that stores point cloud data as plain text. This format is easy to read and understand, allowing users to open and edit content using any text editor. Each line in a PTS file corresponds to a point in 3D space, providing information about its X, Y, Z coordinates and optionally attributes such as intensity or color.
The greatest advantage of PTS is its simplicity and ease of access/editing, which is useful for researchers or developers who want to directly manipulate point cloud data. However, this also means that PTS lacks advanced features compared to binary formats, resulting in lower processing efficiency. When working with large datasets, the text file size quickly becomes a major issue, making upload and processing difficult.
In today’s context, while PTS still has a role in education and experimentation, it is not the top choice for commercial applications. Many organizations and professionals prefer stronger formats that can store more information and support automated processing workflows.
XYZ Format – A Basic yet Limited Future
The XYZ format is one of the most basic and widely used formats for point cloud data. It stores the 3D coordinates of each point as three numeric columns corresponding to X, Y, and Z. Although simple and easy to understand, it can become limited when additional attributes such as color or intensity are needed.
The greatest strength of XYZ lies in its simplicity and ease of use. Users can easily import and export data from GIS or CAD software without technical barriers. However, due to its inability to store additional attributes, XYZ is often unsuitable for applications requiring richer information, such as detailed geometric analysis or advanced 3D modeling.
In today’s industry, while XYZ may be a good choice for basic applications, migrating to richer formats like LAS, LAZ, or E57 provides greater benefits in terms of information and processing capability. Therefore, depending on specific project needs, format selection must be carefully considered.
PLY Format – Sophisticated Storage for Polygon Models
PLY (Polygon File Format or Stanford Triangle Format) is a format primarily designed to store 3D point cloud data along with polygon mesh information. With the ability to store coordinates, color, and polygon structures, PLY has become a popular choice in computer graphics and 3D modeling. In fact, PLY allows users to store richer data compared to formats like XYZ or PTS.
One of the main advantages of PLY is its ability to store detailed surface and texture information of 3D objects. This is not only useful for design applications but also for game development and AR/VR applications. PLY supports both ASCII and binary storage, giving users flexibility to choose the method that best suits their needs.
Although PLY is powerful for storing polygonal data, it also has limitations. Processing large PLY files can be resource-intensive and time-consuming. Moreover, not all software fully supports this format, which can cause issues when exchanging data across platforms. Therefore, when deciding to use PLY, users must carefully consider the working environment and intended applications.
Conclusion
In today’s rapidly advancing technological landscape, choosing the right format for point cloud data not only affects work efficiency but also determines the quality and accuracy of projects. Formats such as LAS/LAZ, E57, RCS/RCP, PTS, XYZ, and PLY each have their own strengths and weaknesses, from ease of use to rich information storage. For projects requiring high precision and detailed information, LAS/LAZ and E57 are often the preferred choices. On the other hand, if you need a simple and easy-to-use format, XYZ or PTS may be more suitable.
To fully leverage the capabilities of point cloud data, users must not only understand the formats but also know how to apply them in specific contexts. Selecting the right format based on project requirements and software is essential to ensure smooth workflows. By exploring more deeply the services related to point cloud, you can optimize workflows and achieve the best outcomes for your project.
At VMT Solutions, we provide comprehensive solutions from scanning, data processing, to creating highly accurate BIM models, meeting diverse requirements from domestic and international clients. Our experienced engineers and advanced software systems will accompany you from survey to final model delivery.
Contact us today for free consultation and discover how VMT Solutions can support your journey in digitizing your projects.
Nguyen Huynh (Rainer)
")
About the Author:
Nguyen Huynh (Rainer) is Managing Director at VMT Solutions, specializing in Point Cloud to BIM workflows for surveying, planning, and engineering offices. He focuses on precise BIM models, clearly defined quality standards, and long-term technical partnerships.
Related Posts
Recent Posts


Tag Cloud


We are proud to have
satisfied customers.
 Gerd Gindullis, Lecturer for digital as-built data capture at Aachen University of Applied Sciences, TerraMeta 3D Laser Service
 Stefan Schramm, Architekt Stefan Schramm
„Your plans are perfect; I’ve never seen anything like this before. These are drawings of the highest quality, I must say. I want to express my sincere thanks once again for your work.“
 Endre Szokolai, Digitalplan-Szokolai
VMT modeled a large industrial building in 3D for our research project. We provided DWG plans to VMT, and they delivered a highly detailed model, including the building envelope, interior walls, openings, and stairs. We had previously contracted a German company for the same object, but unfortunately, it didn’t work out. I was relieved and pleased that VMT handled it so reliably. Thank you for the excellent work and the truly fair price!

Very reliable company, courteous staff, and top-quality work. Our plans were created quickly and accurately. Thank you for that. Highly recommended.

Excellent advice and high 3D modeling quality at a great price-performance ratio… What more could you want? I can highly recommend them…